Wednesday 26 September 2012

The Lesson that Got Away

Hard to believe, I know.

But the lesson on Monday afternoon was just that - a bit of a failure. It was flat, uninspiring and all a bit confusing and directionless.

And if that is how I felt afterwards, how must the kids have felt?

It has taken me four days of reflection to work out what happened. Let me explain.

Equivalent Fractions

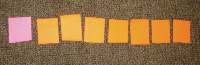
Talking at lunch on Monday with Capitano Amazing, my trusted partner in crime and colleague next door,  we made a cunning plan to get our classes together for the afternoon to do some Maths. I had some activities arranged that I wanted to work through with my class, and thought it might be a good opportunity to involve a second group of willing participants to add to the dynamics.

So we all got together in 4BF, pushed a few desks back and I handed out the coloured A4 sheets of paper. 

"Fold the sheet in half this way," I said, and they all did.

"Now fold it in half again," I said, and they did.

"Oooh, look! Quarters!" I said, and they did.

"Now fold it in half again," I said, and they did.

"Oooh, look! Eighths!" I said, and they did.

"Now shade in half," and they did.

"Now shade in a quarter," and they did.

"Now shade in an eighth," and they did.

At about this point I should have realised that this was become more of a "lesson" and had very little to do with "inquiry".


The Lesson Gets Wobbly


 In my class I have a few "human barometers", students who start to get fidgety (that is, restless, vocal, physical, mobile etc) when the lesson gets too dull.

The human barometers started to fidget.

"Alright everyone, I'm going to give you some coloured counters. I want you to get three counters and show me 1/3 of the counters," I said, and they did. 

Remarkable how patient the kids can be with such a dull event unfolding in the classroom.

"So, now get 6 counters and make a row under your first row of 3 and show me 2/6," I said. A weird request, but most of them saw what I was getting at.

And I kept escalating - get 9 counters, get 12 counters, get 15 counters.....

And when I saw the wall of dull, confused, blank faces I resorted to the white board.

I wrote fractions on the board: 1/3, 2/6, 3/9, 4/12....

"Look! Look! Can you see the patterns?" I said, but they didn't.


The Final Death Song of a Fading Lesson

And instead of taking the hint, I pushed on and did more writing on the white board and tried to force the understanding by increasing the "chalk and talk".

And the harder I pushed, the more painful it was for everyone involved.

To try to wrap it all up and bring it to a conclusion, I gave a final, desperate challenge:

"Alright - show me 1/3 of one of these numbers:   a) 15   b) 60  c) 144  d) 1398."

And the maths lesson faded slowly over the horizon, never to be seen again.


So what went wrong?


Here's what my reflections have led me to believe:

1. My direction was unclear. I knew I wanted to investigate equivalent fractions but this was too vague. I had no clear purpose and it was all a bit directionless.

2. Even though I did attempt to use materials to explore the concept of equivalence, I was shocked at how I turned to "chalk and talk" when things started going belly up.

3. Did you notice how much "I said" there was - me directing traffic and me giving instructions. Certainly there is a place for this, but I think I really went overboard. 

4. As a result of 3. (above) the kids had no opportunity to really explore their own questions.

5. My final, desperate summative activity was more of the pencil-and-paper sort of thing that had disempowered the learners all through the lesson.


Probably more things to think about as well, but that is a pretty significant list to be considering for our next excursion into the wild world of fractions.

Until next time...


Monday 24 September 2012

In Defence of Textbooks


Last weekend was one of my favourite weekends of the year - the Lifeline Bookfair in Canberra. This event happens twice a year and raises money for the Lifeline organisation that runs telephone crisis counseling services. As well as books, there are lots of other items including magazines, games, puzzles, records, CDs, maps etc. The first time I went to the Bookfair I was so impressed, I signed up as a volunteer - I am now the chief record sorter (LPs, 45's, 78's, sets etc).


Here is the building where we set up.........and here are a few of the pallets of stuff we sell


Anyway, I have a great time over the weekend and end up taking home several bags of books, including lots of Maths books. Over the years I have found a few treasures, including a copy of "I Hate Mathematics" by Marilyn Burns.


 I also pick up a selection of textbooks. Why? Well, there's always going to be idea or two that might be useful in any textbook. 

Because textbooks themselves aren't bad things. Care needs to be taken with how we use them, of course, but we need to be equally careful not to throw the baby out with the bathwater.


Some Good Things About Textbooks


1.  They are normally well-organised with concepts arranged sequentially. If nothing else, you can always use the table of contents as a guide for your planning.

2. These days, they have good pictures to represent ideas and problems. This was not always the case - I have a few old ones from the 1920's and 1930's that are all text - makes you appreciate what we get these days.

3. They have lots of examples. Lots and lots of examples. Lots and lots and lots of examples.

4. You can use them when it is too rainy to go outside and do some maths. Fortunately it never rains in Canberra.

5. They have ideas for activities that you can re-work for your local context.


Some Bad Things About Textbooks

1. Textbooks cannot teach the kids. This is the job of the teacher. The book is just there as a tool. The teacher needs to use the tool to get the kids to start thinking.

2. They are authoritative. It is hard to argue with them. They do not accept a second opinion or divergent perspective.  

3. They have answers in the back. This can be a real passion-killer. Only the most dedicated learner will use the answers to work backwards to find a solution. The rest of the class will copy down the answer with no idea of what it means or how it got there.

4. Teachers use them as a crutch. Rather than as a supplement. Like you can't live on vitamin tablets - they are a supplement too.

5. They reduce thinking about Maths to the contents of what is inside the covers. If it says "Year 4 Maths" on the front, then I only need to do the stuff documented inside. There is no challenge to step outside the parameters of the cover and look at Maths in a broader context.

Textbooks - use only as directed.


Textbooks - they are a tool, not a teacher


Saturday 22 September 2012

Show me 31/100

....and boy was I surprised!

 We were using the coloured centicubes to represent simple fractions (1/2, 1/4, 1/10 etc) when I decided to spice it up a bit with a crazy challenge.

"Alright then," I said. "Who can show me 31/100?"

I was anticipating some neat 10 x 10 squares with 31 squares of an alternate colour to represent the numerator - the way I would have handled the problem Well, I was in for a shock!

Here is what the kids came up with. I was determined not to get involved in how they did it, to see what they would invent, and only advised that their fraction needed to be easy to see and simple to explain. I did suggest that colour might be a good way to do this.


Here's a 10 x 10 square with 31 green squares. 
I was expecting to see lots of variations on this theme.
There was only one other that looked similar.


There's 10 groups of 10 cubes. One lime green cube
is broken off and put with the yellow group to make 31.


 This one had 2 lines of 50. The top line has 31 orange cubes.


This is interesting. If you subtract 31 from 100 you get 69.
69 can be divided into 3 multicoloured lines of 23 cubes.
The long line at the top is 31 brown cubes.


And here is something special - use a metre ruler to represent 31 (red) cubes
and 69 (blue) cubes. 


And then, out of left field we get...!


Angry Birds??!
This is really creative but how do I get it to link to fractions?
Interestingly, each of the birds is made up of 23 cubes, and 3 x 23 = 69.
Was this intentional??!!
And if it was, where are the 31 cubes to make it up to 100??!!


Friday 21 September 2012

Talking About Fractions

We are just moving into an exploration of fractions, so after listening to Mr Duey doing the "Fraction Rap", we got down on the floor with some coloured cardboard and scissors.


Mr Duey, everyone's favourite rapping maths teacher


Take the top number, divide it by the bottom number

This was one of the BIG IDEAS I wanted to get across. It is really important, particularly when introducing "unit fractions" - those with 1 in the numerator. 


Here's is what we did. I have included some of the questions and discussion points that we encountered along the way in brackets:


Step 1 - Get some coloured cardboard or paper and cut it into long, thin strips.


Step 2 - Fold the strip in half. (Q. How many different ways can you do this? - A. Infinite) I was hoping they would do it the easy way, as shown in the picture, but I was prepared for those divergent thinkers who wanted to try something different, like a diagonal fold etc.

So, 1 divided by 2 = 1/2  (top number divided by the bottom number, like Mr Duey said)


Step 3 - Fold it in half again. (Hmm, half of a half is a quarter; there's 2 quarters in a half)


Step 4 - Fold it in half a third time to make eighths. (So, how many eighths in a whole? in a half? in a quarter?)


Step 5 - Unfold the shape and cut along each fold line. (How many pieces will you end up with? How many cuts do you need to make?)


Step 6 - Swap one piece with someone who has a different colour. (What fraction do you have now that is a different colour? What fraction is the original colour?)


Step 7 - Now swap 2 more pieces with the same person. (What fraction now is the original colour? the new colour? Which is biggest? Which is smallest? What happens to the fraction when the numerator gets bigger? What happens to the fraction when the numerator gets smaller?)


 So what?

 This is all pretty basic stuff. Yep, we cut up some paper and had a bit of a play. So what?

Well, I wanted to get the kids tho articulate their observations about what they could see in front of them. I find this produces some good insights into what they are thinking. So we went on to....


Step 8 - Now write 2 statements about this arrangement you have in front of you.

And here's a selection of what the kids wrote:

3/8 of my shape is pink.

More than half of my shape is blue.

5/8 of my shape is blue.

3/8 < 5/8

5/8 is more than 3/8

5 eighths are red and the rest is blue.

Less than half of my shape is green.

1/8 + 1/8 + 1/8 + 1/8 + 1/8 + 1/8 + 1/8 + 1/8 = 1

3/8 and 5/8 = 8/8

There are 3 blue eighths.

My shape is 8/8.

All the pieces are equal.

3/8 is equal to 6/16.

3/8 < 7/8


And all of this from a really simple activity about cutting up some coloured pieces of paper.


Thursday 20 September 2012

Same Perimeter, Different Area

Part of our exploration of area and perimeter led us to the idea that you can draw different shapes that have the same perimeter but with different areas.

What does this look like?

Well, we started with a square that was 4 x 4. Interestingly, this square has an area of 16 (square cms) and a perimeter of 16 (cms).


Next question was, can you make another shape that has the same perimeter? The area might change but the perimeter needs to stay the same.

Here is what the kids came up with:

This kind of surprised me - I was thinking rectangles with bits missing out of them. 
Trust the kids to think of solutions that the teacher had not even imagined.


Is there a Pattern?

Checked out a link to some videos put together by Dan McQullan, an associate on Twitter (@normalsubgroup). These videos were produced with an elementary school math club he operates. The one I was interested in is called "Rover the Rectangle - the Difference of Two Squeaks".


 It did get into some sophisticated algebra that went over the heads of most of my class but it had some great visuals to explain how a shape can change in area but keep the same perimeter.


Tuesday 18 September 2012

Same Area, Different Perimeter

One boy's personal exploration into Infinity

We'd been doing all that investigation into 2D shapes, looking at area and perimeter. We had  found shapes that had the same perimeter but different area. You may have read about it on a previous post.

This provoked one boy to inquire in the opposite direction.

"What if I keep the area the same, but change the length of the sides?" he mused.

Not content with that, he continued, "...and what if I use triangles instead of rectangles?"

Here is the page of diagrams that he drew to explore this idea:


He started with a right angled triangle with sides 8cm and 4cm = an area of 32 square cm (Sorry - I don't think I can do superscript for index notation on this text editor.)

Then he doubled the long side and halved the short side: 16cm x 2cm = 32 square cm

Realising that he would go off the page the next time he doubled the dimensions of the long side, he decided to use a scale of 1:2 for the next diagram:  32cm x 1cm = 32 square cm

His Stunning Conclusion

"You know what?" he asked. "I think there is an infinite number of triangles with an area of 32 square cms. I could keep on doubling and halving forever."


Thursday 13 September 2012

Maths and the Year 6 Exhibition - What Happened

I posted a few weeks ago about the Year 6 Exhibition and my hopes that the kids would carefully consider how they were going to incorporate their knowledge of Mathematics into the process.

Well, the exhibition is here and I must say, I am impressed. Hope you will be too. Here are a few examples of how the kids used Mathematics to pursue their inquiries into "Conflict".

Tables of Data 

Lots of groups conducted surveys across the school community and presented their results as data tables. Some of these tables were very elaborate and contained very detailed information. Much use was made of multiple columns on a table to present results for different groups.


 A survey of Year 8 students about body shape. Note use of tally marks and numbers to summarise results. One problem with having all the results presented in one table is that questions that have different responses (eg yes/no; sliding scale etc) need to have different boxes for their data.


 Another table, this time using colour to distinguish between the age/year group of the respondents. 


Venn Diagrams

Venn diagrams are a really useful way to present information - they are simple, they are visual and they give an insight into how the creator understands the ideas they are representing.


This Venn diagram explores the emotions felt during conflict in the family and conflict in a war. This particular diagram is highly subjective and there is no explanation of where the ideas came from or how they were allocated to a particular circle. 


 Picture Graphs

Some picture graphs can be quite clever in their simplicity. Their effectiveness stems from their visual nature and the use of interesting images to represent values.


 This interesting series of graphs used the picture of the animal as the outline for the graph and then the data was represented by colouring in appropriate proportions of the animal.


Pie Charts 

Many groups used pie charts to show their results. This required some interesting calculations as students worked out angle sizes as a ratio of their scores out of the total population. Many simply plugged numbers into Excel and printed out a nice colour chart. 


Here are some hand-drawn graphs showing information about palm oil. This group was smart enough to keep the responses to yes/maybe/no - certainly made the graph accessible and relatively simple to construct.


Bar/Column Graphs

Many groups represented their data on bar or column graphs. This was particularly effective when showing questions where the respondent had multiple alternative responses or the data was showing a comparison of quantities or values.


This was an interesting graph for several reasons. The group had survey over 200 people and organised their data into a series of effective graphs. They also provided an interesting explanation of their results. The data was honest - but what does it mean to say that 6 people were in favour of animal cruelty?


  Some Other Really Interesting Ideas

And here's some other ideas that the kids came up with. They are really special - hope you enjoy!


 Using balance scales - put a marble in the side you vote for


Same idea using coffee beans to show support for Fairtrade. 


Put a soccer ball on the field you show your response - yes, no or maybe


 A graph using Skittles. This group has to scale down their data. They would have needed 2 million Skittles otherwise and couldn't find a bottle big enough.


Other ways to use bottles to represent data


 And the final example - this group made their own basketball hoops and you could indicate your response by shooting a ball through the appropriate hoop - yes or no.


Tuesday 11 September 2012

5000

To Celebrate the 5000th visit to this blog since starting in April 2012, I wanted to ask.....


What's so special about the number 5000?


  • 5000 = 5 x 2 x 5 x 2 x 5 x 2 x 5
  • 5000 = 50 + 150 + 250 + 350 + 450 + 550 + 650 + 750 + 850 + 950
  • it is the largest number that doesn't repeat any of its letters when spelled in English - this feature is known as being "isogrammic" 
  • in binary code it is 1001110001000 
  • $5000 bills were issued in the USA in 1878, 1918 and 1934
  • the 5000m record for men is 12min 37.35secs and for women is 14mins 11.15secs
  • Morgan Spurlock averaged 5000 calories each day for a month in making the documentary "Supersize Me"
  • Jesus fed the 5000, using 5 loaves and 2 fish. The number "5" can signify grace and multiplying it by 1000 can indicate global scale - so 5000 might imply grace on a global scale (This idea is from the following website: http://www.theopenscroll.com/beyond_veil/feed5k.htm)


    The Torana SLR 5000


    Every car should use it.


    The Nikon Coolpix 5000


    Looks like a great movie!


    The US $5000 note


    And maybe I should track some of this down to celebrate with


Monday 10 September 2012

The Difference Between Area and Perimetre

....and how to avoid confusion


We've been exploring the area of 2D shapes and I have been postponing the introduction of the concept of "perimeter". Seems just about every text book you open introduces area and perimeter at the same time and from my experience this often leads to confusion for the kids.

So I've been putting it off until this morning.

And surprise, surprise, when I started talking about perimeter - we had confusion. It was limited, thankfully, to a few students only, probably because we had done so much focus on "area" that they already had that concept covered.

But it made me think, what would the kids say? How would they explain the difference between area and perimeter? And what suggestions would they have to help avoid any confusion?


The Difference Between Area and Perimeter According to the Kids...


  • Area is the stuff inside. Perimeter is the outside line.
  • Area is the whole thing and perimeter is just the outside.
  • Area is counting the shape inside.
  • Perimeter is the lines of the shape added together.
  • Perimeter is the length around the shape, area is the space in the shape.
  • One you multiply and the other you add.
  • Perimeter is the outline.

And Some Strategies to Avoid Confusion...


  • Area is 2D and perimeter is length which is only 1D.
  • Perimeter has "meter" in it so it is length.
  • Use the "Kruger Method" - named after one student who decided to trace around the outside of a shape using a coloured marker pen so he could add up the perimeter as he went. 
  • Use the "Walker Method" - named after the student who divided his shapes up into square centimetres with a ruler and then put a coloured dot in each as he was adding up the area
  • "For fun, my mum and I say 'peri' means outside. So perimeter means length around the outside." - which is pretty good. Other meanings include "about", "around", "near", "surrounding".

The Kruger Method


The Walker Method


So what?


My advice would be, don't introduce area and perimeter at the same time.

Choose one of them and get it consolidated before you move on to the other one.

Use really simple ideas, like the Kruger Method and the Walker Method, when working with these concepts.

Ask the kids to tell you what their ideas are and what they are doing to tell the difference - it offers a great insight into their brains and how what features they are focusing on.