Wednesday 27 November 2013

Fun with Volume

We'd been looking at volume and capacity in class for a few days and I came across an activity in an old book that I bought for $2 at the Lifeline bookfair.


 Mathematics for Elementary Teachers - an activity approach

 The Task

So the task was to get a 16 x 16 grid and make a series of regular prisms that have a square base. 


Here's what it looked like:

Shape 1 = 14cm x 14cm x 1cm 


Shape 2 = 12cm x 12 cm x 2cm


Shape 3 = 10cm x 10cm x 3cm etc

The kids were able to see a pattern emerging. Each time you increased the height by 1cm, the sides of the base decreased by 2cm.

They were able to construct a series of 7 shapes:


 Yes - it got a bit messy...

 Eventually we all had a set of shapes.


What Next?


The task then was to arrange these shapes in order from smallest to largest without actually measuring them or doing any calculations.

Here's what a few pictures of what the kids thought...


To help us discuss the activity, we decided to name each shape after its height. So Shape 1 has a height of 1cm, Shape 2 had a height of 2cm etc.

Here are a few comments from the kids about what they noticed when they tried to order the shapes: 
 
-->
We think they are all the same.

Shape 1 would be the largest because it is long and has the space of the tallest one. I’m just wondering if they would almost be the same since they has the same squares building it.

I reckon if you have a smaller base the sides get bigger. If you get a bigger base you get smaller sides. The one with the biggest base is the biggest shape because you are losing squares each time you fold the edge up.

I’m not exactly sure about Shape 6

Having the biggest base doesn’t mean you have the biggest capacity. Just like if you have the tallest height it isn’t going to have the biggest capacity.

I found this really interesting because I thought that shape 4 was going to be the biggest.  I also found it interesting that we used the same sized piece of paper for every shape.

I found that the largest shape in length isn’t necessarily the shape that has the largest volume.

I found it interesting because the capacity of the shape went up then down. I thought that Shape 4 would be the biggest because it had a big area (base) and was quite high.

I found that the tallest shape will not necessarily have the larger amount of volume.


Doing Some Calculations

So finally we decided to do actually work out the capacity of each shape. Some kids chose to use some of the base-10 blocks to work this out.


When we had finished, we drew up a table of data:


Now this was really interesting. Starting with Shape 1, the capacity increases for Shapes 2 and 3, then it starts to go down. This is not what any of us was expecting.


Then we began to wonder.

Is the height of 3cm going to give us the biggest capacity?

What if we try 3.1cm? Or 2.9cm? Will they both be smaller than 3cm?

So we did a bit a table:


And constructed a graph of this data:


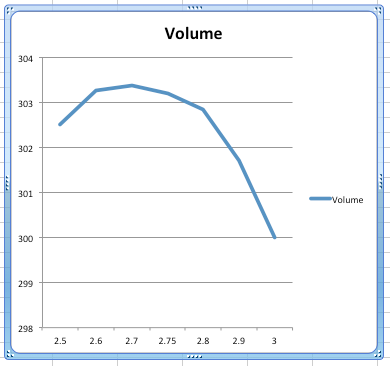
And that was really interesting.

And the kids started asking, "What if we try somewhere between 2.6cm and 2.7cm? What about 2.65cm?"

Maybe you can try that one at home....

Don't you love the inquiry mindset?


Tuesday 26 November 2013

My Report Comments Wordle

I've finished writing my class reports so I thought I'd do a Wordle of the Maths comments.

Here it is:


So, what does this say about me as a teacher?

Well - looks like some of our big topics this year were multiplication, fractions and decimals. Division is in there too. Hmm...lots about "number", what about the other elements of maths?

Knowledge, facts and understanding are all important.

There are a few positives in there - good, excellent, confident.

I'm a bit concerned that "practical" and "relationship" both get only a small mention. Why do I not make more comments about these aspects of learning? And what about patterns? Is that in there anywhere?

Try it yourself. Plug the text from your report comments into Wordle - see what comes out the other end.

Good luck!

Thursday 21 November 2013

Find the area of a circle......without using pi

I haven't had much time to write on the blog lately as we are busy assessing and writing reports. Don't you love end-of-year?

As part of the assessment process, we used a pencil and paper test to confirm what we were thinking about Maths skills and concepts.

We had done a bit of inquiry into find the area of 2D shapes with straight sides. We hadn't looked at circles.

So I thought I'd throw in a question about finding the area of a circle. I knew that some of the kids knew the formula so I made the rule that they were not allowed to use pi in any of their calculations.

Just wanted to see what they would do.

So here is the question:

You are given a circle with a diameter of 10cm. Find the area of the circle by dividing it up into smaller shapes. (Do not use pi in any of your calculations.)

(I cheated - I used pi and got an area of about 78.54cm2..  I wanted to have some "real" value to assess the accuracy of the students and their methods against.)


And here a some of the solutions that the kids came up with...


Method 1 - Break it up


Nice idea. Using regular shapes such as squares and rectangles, we can get an approximation of what the area of the circle might be. It is a bit complicated in that it involves lots of different calculations, but the solution presented here was pretty close to our target.


Same strategy but choosing different shapes. This attempt is a bit less detailed so it loses a bit of accuracy but the end solution is also pretty close to out target. The students quickly saw that since the shape is symmetrical, some of the calculations only need to be done once then multiplied by the number of times that shape appears in the diagram.


Method 2 - Subtract the corners from a bigger square


Seeing that the circle has a diameter of 10cm, it would fit into a square with sides 10cm x 10cm. We could then subtract the "corner" triangles to get an approximation. I'm not sure that the student measures and calculated the triangle accurately as their solution was a bit out but the strategy and process was excellent.


Same general idea but this time using rectangles in the corners instead of triangles. 


Method 3 - Using a grid


This student drew up a 1cm grid and used this to count the number of squares. They worked out the number of complete squares and then added half the number of incomplete squares to get a pretty accurate result.


Using a grid for a quarter of the circle means you only have to count a quarter of the number of squares to calculate an approximate area that is very close to our target.


And finally, this student chose to use a 4cm grid to get their solution which was slightly higher than the others but definitely demonstrated a good understanding of the problem and what to do to solve it.


Not everyone got a solution to this question. Several were not sure what to do or failed to use their knowledge to calculate accurately and as a result their solution were way out. 

But all of this provided some useful information - either confirming what I already suspected about each student or giving me an insight into the way they thought.

So....back to the report writing!


Tuesday 19 November 2013

If the world were a village of 100 people...

We are looking at "How We Organise Ourselves" - our transdisciplinary theme for an inquiry into our central idea: "The global marketplace and the distribution of resources impacts individuals and communities in different ways."

There are plenty of facts and figures out there to consider using the idea of the world's population being scaled down to 100 people. This was a great opportunity for us to use some of our maths skills to represent this data.

We looked at a few examples to "tune in" our thinking. Here are some of them:


And then we had a go at doing some of our own.

Here is what we got...


33 of the people in the village would believe in ghosts, aliens, witchcraft etc - how many of them would be 12 year old boys?


A great picture to show the distribution of males and females - and yes, we know the male and female signs are the wrong way round.


Unfortunate student with a broken arm was unable to draw a picture or graphic so he used a computer instead. I wonder how many of the 100 people in the village would have broken arms?


Only 77 of the people in the village would have shelter.


A great picture to show the access people have to clean water.


This was a really successful activity. It combined our knowledge of percentages in creative ways with our unit of inquiry. And it was fun.


-----------------------------------------------------------------------

PS - We had considerable discussion about whether it should say, "If the world were..." or "If the world was...." You will notice that the kids have written the later. Apparently this is incorrect. According to the Future Unreal Condition tense (Form 2) it should be written "If the world were..."
http://www.englishpage.com/conditional/futureconditional.html